Case study · Founder / Developer
findstorage
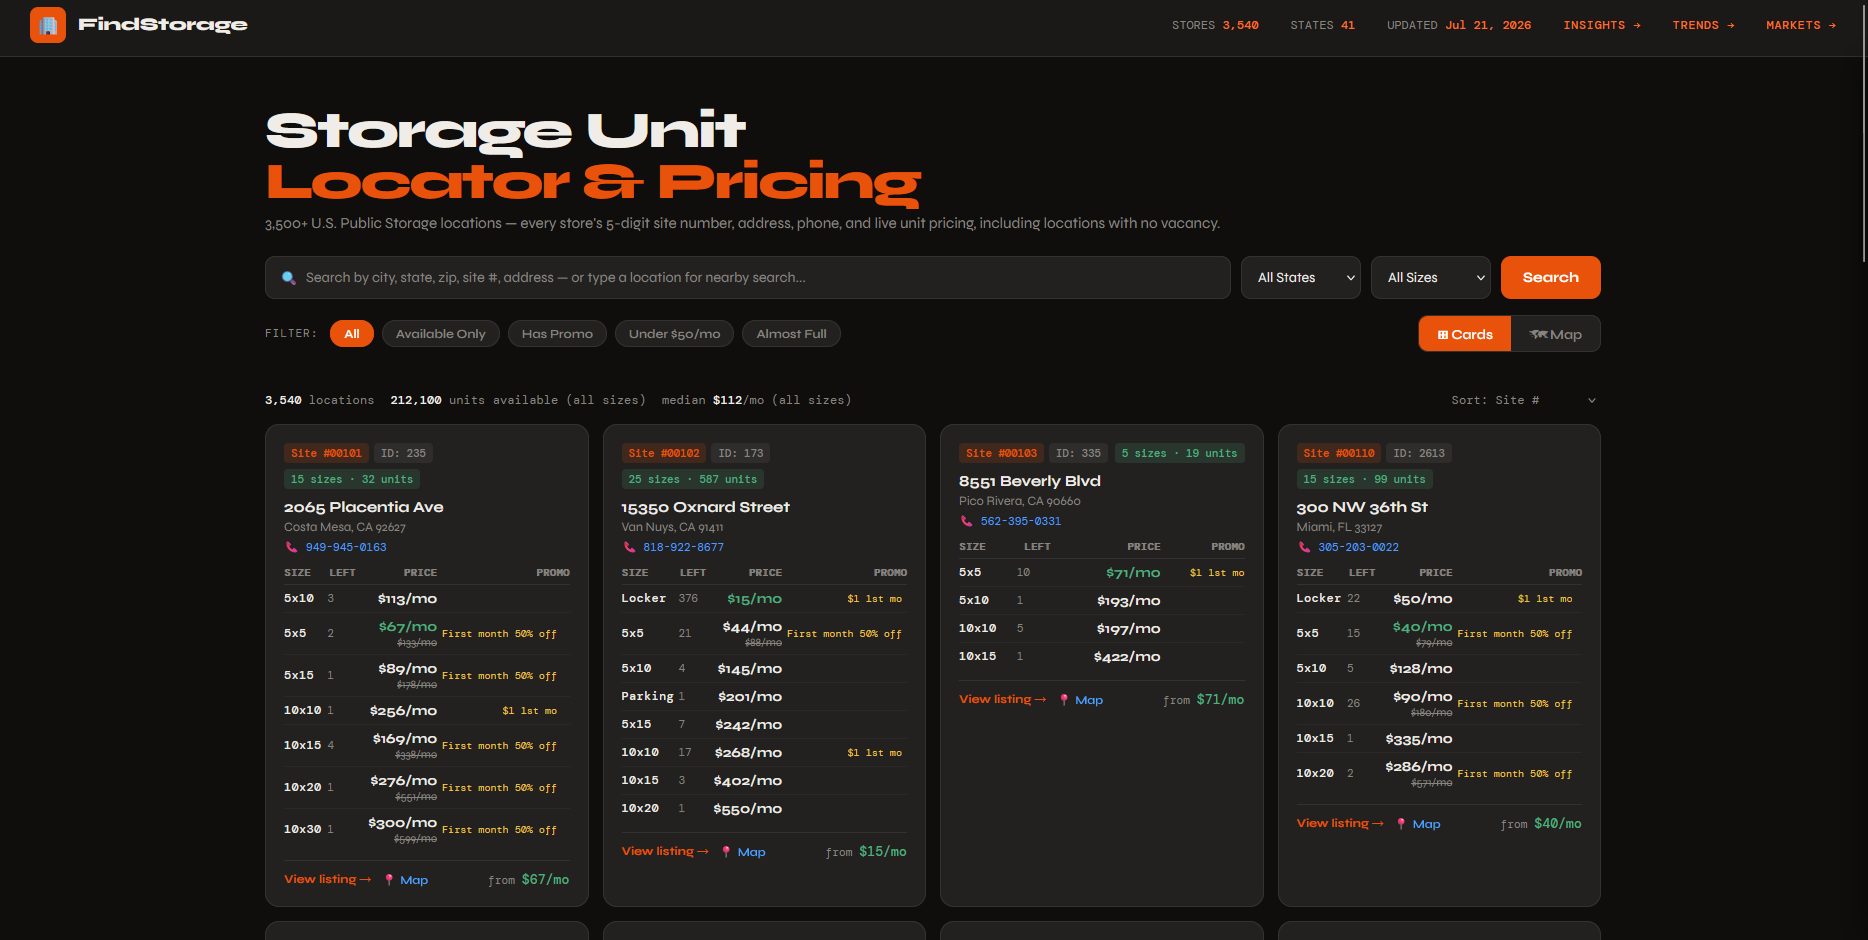
It started as an internal problem: a five-digit store identifier the team I was on needed every day wasn't published anywhere. The tool that found those numbers turned into a national directory, and the pricing data came with it. Built to run unattended and stay correct when the market moved — when an operator merger added roughly 1,100 stores overnight, the daily pipeline absorbed it with zero manual intervention rather than needing to be rebuilt around it. Collection ended 25 August 2026 after I re-read the source's terms of use; the site stands as a dated archive.
This began as a store-ID finder. A five-digit site number that the team I was on needed daily wasn’t published anywhere, so I built the thing that found them — and the market data came along for free. It grew into a national directory of advertised self-storage prices and the research that falls out of tracking them over time.
A seven-pass discovery scraper collected publicly published rates for 55,332 advertised price points across 4,664 stores in 43 states, running itself daily through GitHub Actions with commits landing unattended. The pipeline had safety rails: a run aborted rather than publishing if store count dropped below a floor or fell more than 10% against the previous run. It took 48 consecutive daily snapshots with no missed days, and the rate-change log holds 396,402 advertised price changes and 148,870 promotion changes. When a large operator merger added roughly 1,100 stores overnight — a ~30% jump — the pipeline absorbed it cleanly and surfaced the shift in the trend data instead of choking on it.
Collection ended 25 August 2026. Before adding a second operator to the dataset I sat down to read their terms of use, which raised the obvious question of when I had last read the first operator’s. Theirs prohibits automated collection. I stopped the same night, disabled the scheduled job, and the site now stands as a dated archive rather than a live directory. The engineering below is what the project was; none of it depends on the collection continuing.
What 48 days of daily snapshots turned up
Advertised rates do not drift. They sit completely still for days and then move in coordinated waves. On 18 of 46 days not a single tracked rate changed; on thirteen days, tens of thousands did. Nothing observed falls between those two states — the busiest quiet day logged 2,443 changes and the smallest wave logged 12,792.
The largest wave repriced 88.7% of tracked inventory in one day. Individual stores move decisively and in opposite directions within the same wave, at three to five times the rate a shuffled null predicts, so the national median can sit flat while most of the book moves under it.
One 5×5 unit shows the mechanism in seven rows. Its advertised list rate changed eight times in six weeks while the promotional badge on the page never changed. Between 20 and 22 August the advertised saving grew from $123 to $176 — and the first month went from $46 to $66. The discount is a fixed percentage; the number it is a percentage of is not.
The analysis I care most about is a matched-pairs design. Averaging prices confounds the attribute with the market — climate-controlled units are more common in expensive metros, so a naive average credits the feature for the city. Instead it compares units of the same size, at the same store, differing in exactly one attribute (climate control, floor level, drive-up), so location and local demand cancel out and what’s left is closer to the price of the attribute itself. Climate control carries roughly an 18–22% premium on that basis. Records are linked across sources by 150m haversine distance plus ≥60% name-token overlap.
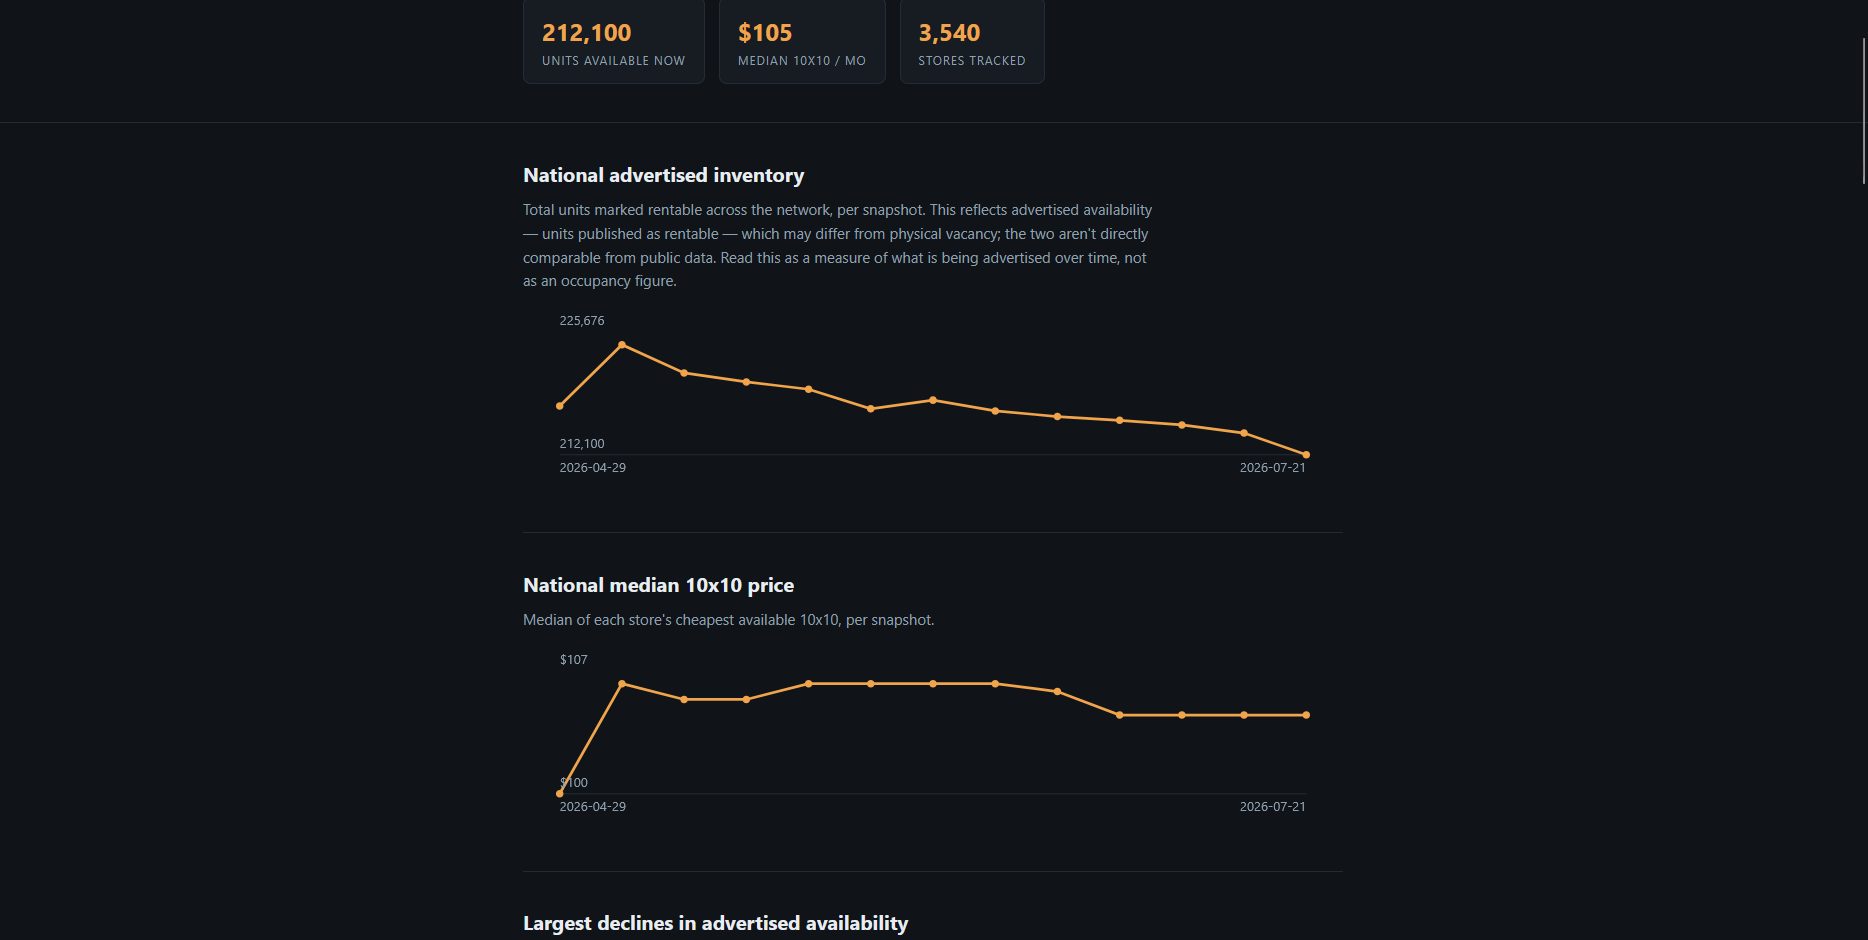
Everything is cut by size (locker through 10x30 and parking). 414 ZIP3 markets are computed nationwide rather than hand-picked, each with a client-side drill-down: store count, units per store, promo share, median price by size with price-per-sqft against the national figure, trend sparklines, and a renter leverage score. Movers tables surface the largest availability drops and restocks and the largest 10x10 price moves over a rolling window, and a per-store price-history view charts a single store’s advertised prices over time by unit size. Moving the detail data into a sidecar fetched on first interaction kept the whole drill-down to +3.6KB gzip on initial load.
How the numbers were checked
Every failure below was found in my own data, by me, and every one of them had been quietly wrong for some length of time before it was caught. They are on the page because the corrections are the part worth reading.
A number with no command behind it decays. A hand-typed coverage figure turned out to be wrong by 5.6×, and had been wrong for an unknown period — nothing in the pipeline could say how long, because nothing had ever recomputed it. Every published figure is now emitted by a committed script on each run, and the script refuses to write its output file if any value comes back null. A stale number never drifts randomly; it drifts in the direction that flatters the page.
Counts and statistics have to describe the same rows. 56 rows in the rate log recorded a price moving from zero — a unit arriving in the dataset, not a repricing. They were excluded from the medians but still counted in the daily totals, so two numbers on the same page were computed over two different populations. The filter now runs before the tally rather than after it.
Derive the window from the thing that defines it. The observation window was originally read off the change log, which meant days with no changes weren’t days at all. It reported 41 days and 13 zero-change days. Taken from the snapshot dates instead — the actual record of when the scraper ran — the real figures were 44 and 16. Three days had vanished because nothing happened on them.
A step in the data is not a movement in the market. Twice the tracked population changed size sharply: 441 stores entered on 9 July and 1,096 on 23 July, the second being a merger. Averages across those dates compare two different populations. The breaks are detected from the store counts rather than asserted from the news, and every chart that crosses one draws it as a labelled rule — because the misreading being prevented is someone glancing at the shape of a line.
Zero is not the same as nothing. 9,164 of 34,416 store-size listings are quarantined from the movers tables, each with a named reason recorded to a CSV. The one that matters most: a store whose advertised availability drops to exactly zero and stays there has stopped publishing availability, not rented out its entire inventory. Ranked naively it would be the largest mover on the page and the least likely to mean what it says. The same logic runs in reverse for stores that begin publishing.
Test the pattern against a null. The claim that individual stores move coherently — decisively, and in opposite directions inside the same wave — is measured against a shuffled null rather than eyeballed off a chart. Stores move together at three to five times the rate the shuffle predicts.
Fail loudly, in the right direction. A run aborts rather than publishes if the store count drops below a floor or falls more than 10% against the previous run, so a source changing its markup surfaces as a stopped pipeline the same day instead of as quietly missing rows. The failure mode that costs you is the one that still produces plausible output.
Worth stating plainly: these are advertised online rates, not what any given renter ends up paying. Coverage is whatever the discovery pass found published, so it is a sample rather than a census, and matched pairs control for store and size — not for everything. The dataset is closed as of 25 August 2026 and will not be extended.